As part of an active project, I’m exploring ways to iteratively build a dataset of images for use in training classification models.
This article documents some early activity, but does not reach conclusion on any repeatable processes.
Problem Overview
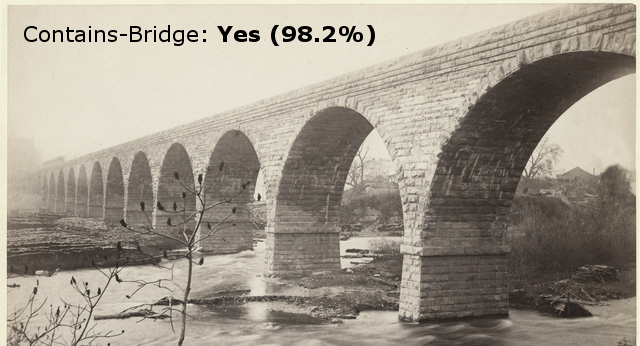
For this example I’m working to build an image classification model which is able to identify whether a picture contains a bridge:
This will be one of a larger set of models, trained to act as membership functions to identify various types of structures. For example, water towers, lighthouses, etc.
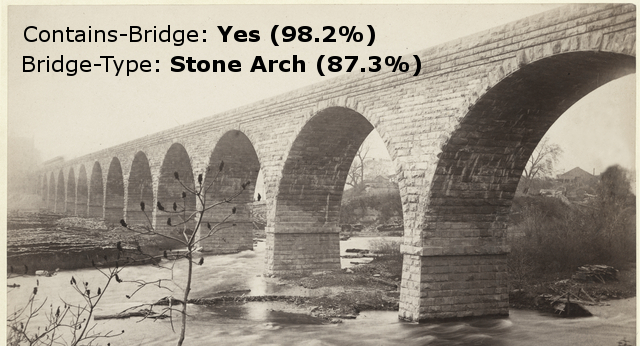
Eventually, once we have a large-enough dataset, another model will be trained to more-specifically classify the type of bridge shown in the image (e.g., truss, suspension, etc.):
Given the large number of images required to train an effective model of this type, I need to find a more-efficient process for identifying and labeling images to include in a training dataset.
Source of Data
The context for my larger project is identifying historical photographs. Given this, most of my training data will be coming from the collections of historical societies, universities, and other similar organizations.
Though I’ll save the details for a future post, there are a couple of standards used to provide programmatic access to these digital collections. The one I’ve focused on is called the “Open Archives Initiative Protocol for Metadata Harvesting” (OAI-PMH).
I am maintaining a list of organizations providing OAI-PMH access to their collections, and am downloading images via this standard. At the time of this writing, I’ve downloaded ~150k images for use in model training and am continuing to grow this set.
Iteration #1
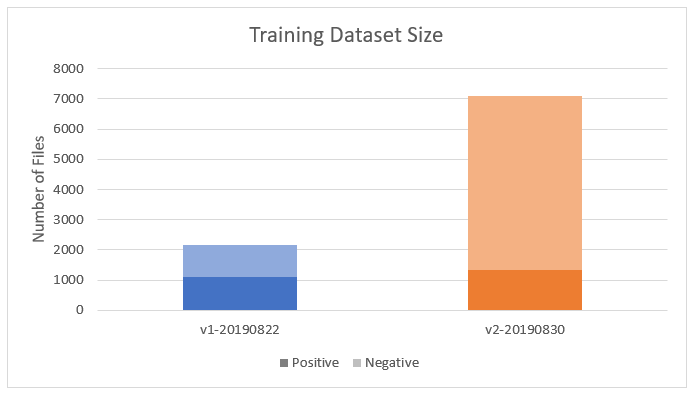
For the first training iteration, I manually labeled a set of 2,172 images. Half of these images contained bridges, and the other half did not.
I then did a random 80/10/10 split of this data for Validation/Training/Test. This resulted in 1,736 images for training, 216 images for validation, and 220 for testing.
A pre-trained MobileNetV2 model was then trained (via transfer learning) over 75 epochs, to reach an accuracy of ~89% against the Test dataset. For the rest of this article, this version of the model will be named v1-20190822.
The plan was then to use this model to more-efficiently build a larger training dataset. The larger dataset would be pulled from the images I had downloaded from historical societies…
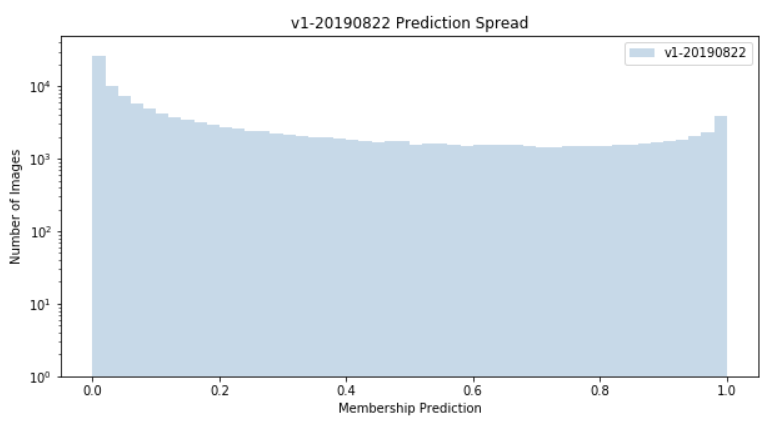
At this point, I had 145,687 total candidate images downloaded. I ran the model against all images and found:
- 42,733 images (29.33%) were labeled as containing a bridge.
- 11,880 images (8.15%) were labeled as +90% confident in containing a bridge.
A histogram of all predictions is shown below. Note that, in this visualization, a value of “0” represents 100% confidence that the image does not contain a bridge:
In reality, this first model performed very poorly. Many images were being incorrectly classified, and in non-intuitive ways — for example, many portraits were being classified as containing bridges…
In hindsight, this first iteration could have been better if I’d done a better job at compiling the negative images (i.e., those not containing a bridge). Nearly all of these images were external, architectural shots, which led to model confusion when it encountered a more normal distribution of photograph types.
This would be resolved in future iterations.
Iteration #2
To build the training set for the second version of the model, I ran the first model against all 145,000 candidate images, and found those images labeled as containing bridges with at least 92% confidence.
This left me with 7,107 images. After manually labeling these images, I was left with 1,346 photos containing bridges (“positive”), and 5,761 which did not (“negative”). A comparison of the size of datasets, between iteration #1 and #2, follows:
I used this new dataset to train a new version of the model, following the same process and architecture as previously. After 75 epochs, the model reached ~88% accuracy against the Test portion of the dataset.
I then ran this second version of the model (named v2_20190830) against the full set of 145,687 candidate images and found:
- 4,265 images (2.93%) were labeled as containing a bridge.
- 711 images (0.49%) were labeled as +90% confident in containing a bridge.
A histogram of all predictions from this second model is shown below:
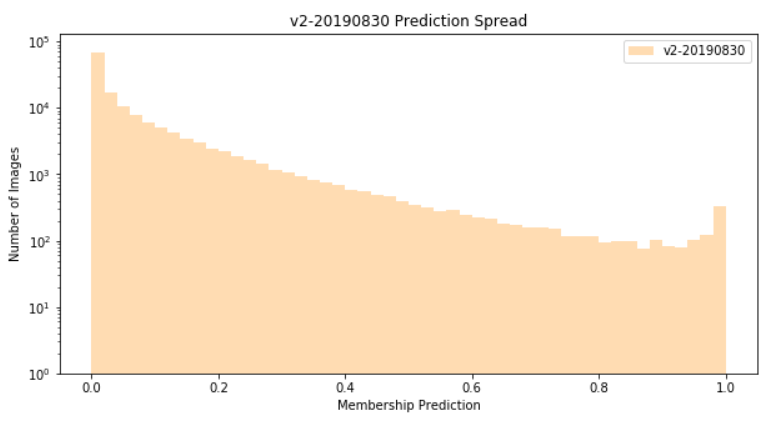
Qualitatively, this model performed much better than the first, and most of the incorrect classifications were very intuitive — for example, many false-positives were non-bridge structures that contained elements that looked like trusses or arches, which are very common in bridge designs.
Model Comparison
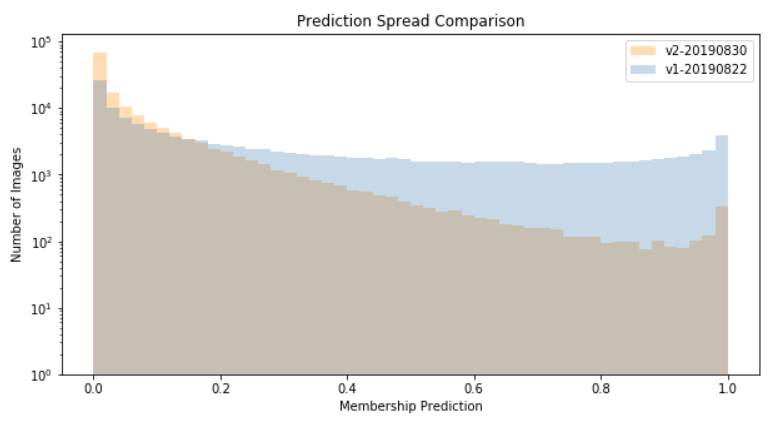
As I iterate this process, and train against larger datasets, I would expect my models to become much more discriminating. In the early iterations, this likely means that a smaller percentage of total images are included in the “positive” class.
Overlaying the histograms of these first two models is interesting, as it shows evolution in that direction:
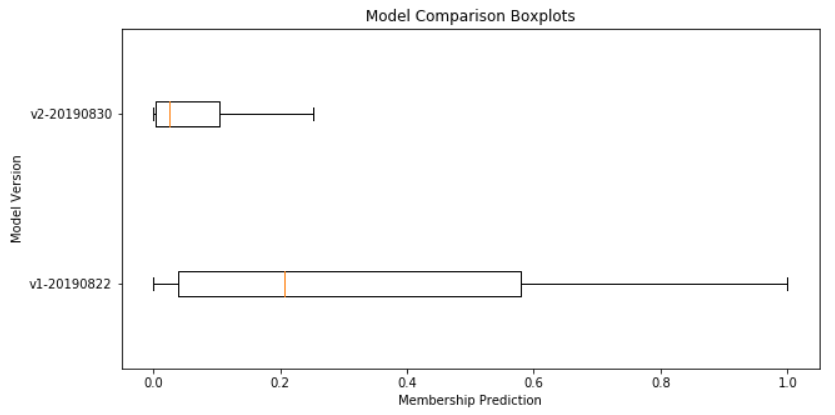
Another way to view this information would be to plot the same information in box plots (here, I’ve removed the outliers for visual clarity):
Next Steps
I’m actively working on the third iteration of the training dataset, and will update in a future post.
Toward this end, I’m downloading more candidate images from historical societies, and will be running the v2 model against this larger candidate set to grow my dataset, ahead of training the next model.
More to come!
1 thought on “Bootstrapping Model Data”